by
Rene T. Estomo
Some nice looking graphs
In this investigation, I would like to explore the equations that could produce nice looking graphs. The generated graphs could be used to motivate students to work on some mathematical exploration. My exploration starts with the equations below.
For what values of n does
![]()
Do an animation driven by n for the range of values where n produces a graph.
What if :
![]()
Try the range of n from -2 to 2 in 100 steps.
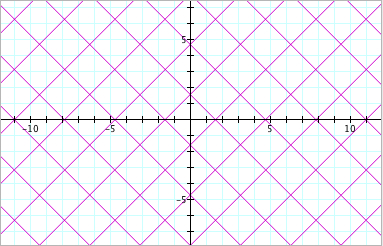
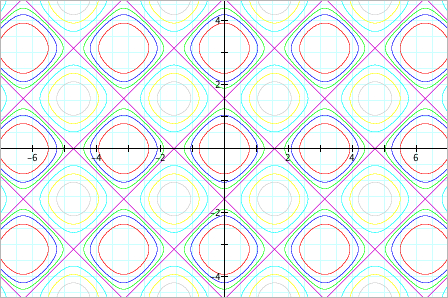
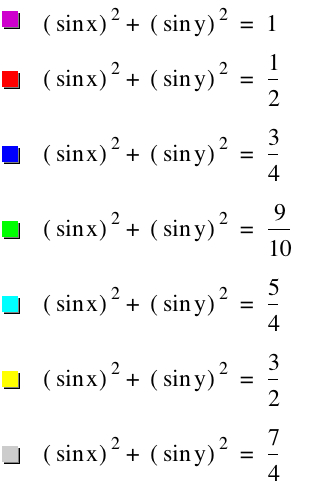
Let's start looking at the graph of
where n is set at 1, 1/2, 3/4, 9/10, 5/4, and 3/2.
n = 1 |
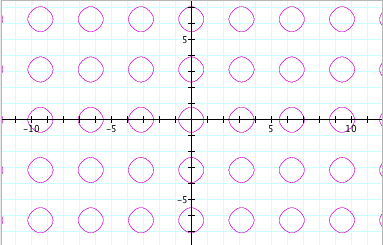
n = 1/2 |
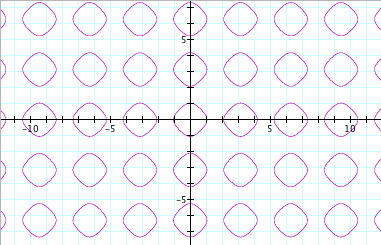
n = 3/4 |
n = 9/10 |
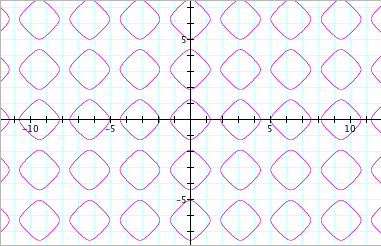
n = 5/4 |
n = 3/2 |
The graphs above may not appear interesting to students' eyes. They look similar except for the first graph, n=1. To make this graphs more appealing to students, the color must be changed in each value of n and then overlap the graphs.
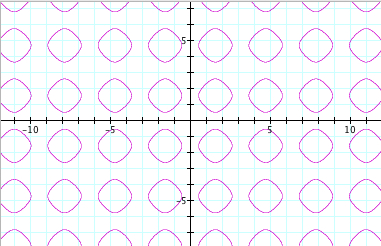
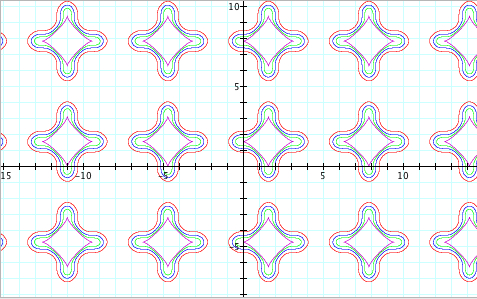
Below is the finished product.
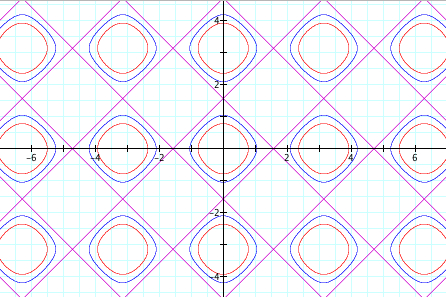
n = 1
overlayed by 1/2
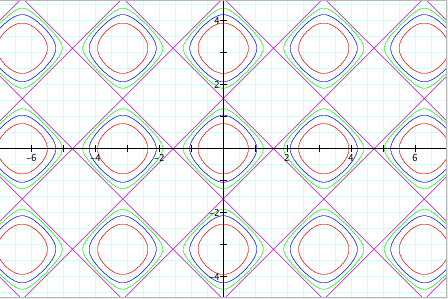
overlayed by 1/2 and 3/4
ovelayed by 1/2, 3/4 and 9/10
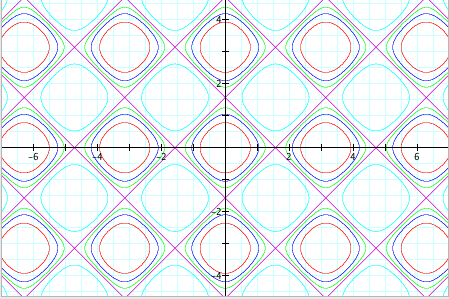
overlayed by 1/2, 3/4, 9/10 and 4/5
overlayed by 1/2, 3/4, 9/10, 4/5 and 3/2
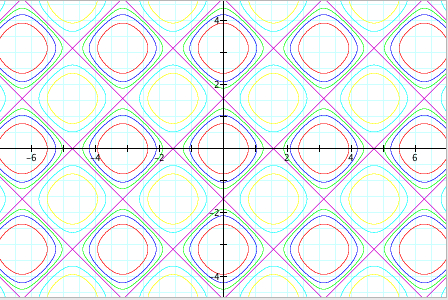
overlayed by 1/2, 3/4, 9/10, 4/5, 3/2 and 7/4
This is the last picture, same as the one at the left.
Definitely, the last two graphs will catch students' attention!
Here is the animation of the equation.
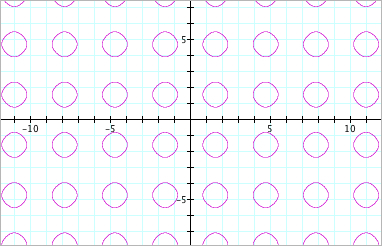
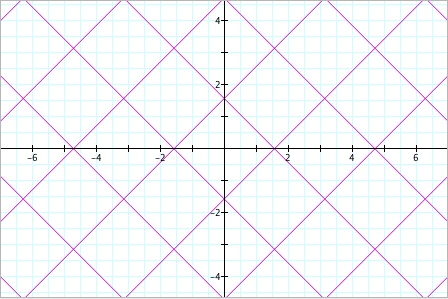
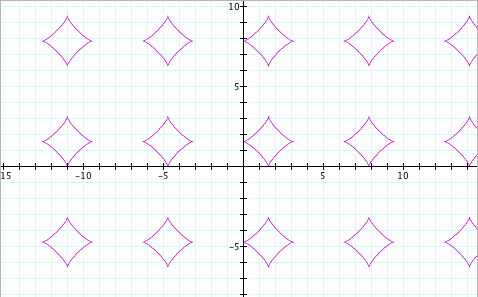
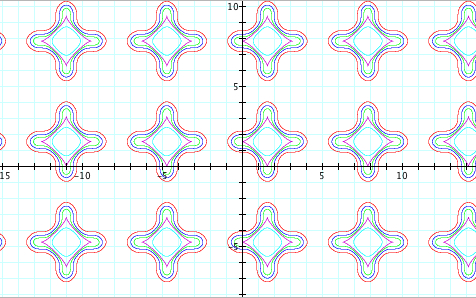
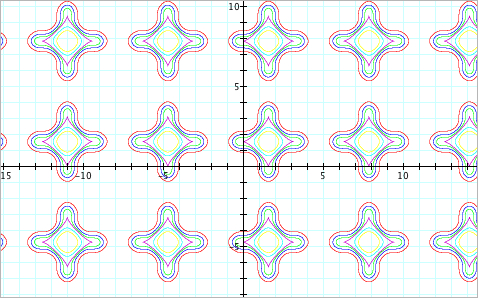
Now, let's try the equation
where n is set at 1, 1/2, 3/4, 9/10, 5/4, 3/2 and 7/4.
n = 1
overlayed by 1/2
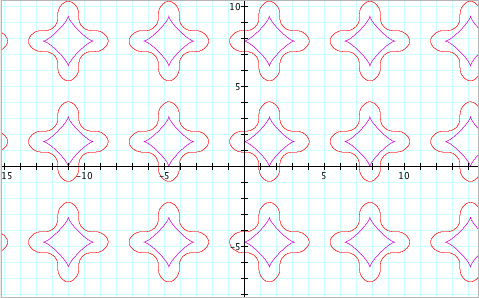
overlayed by 1/2 and 3/4
overlayed by 1/2, 3/4 and 9/10
overlayed by 1/2, 3/4, 9/10 and 4/5
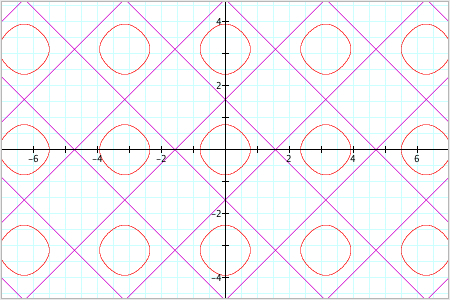
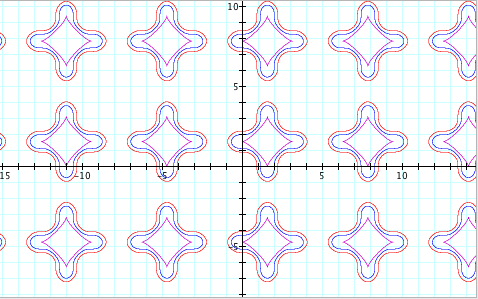
overlayed by 1/2, 3/4, 9/10, 4/5 and 3/2
overlayed by 1/2, 3/4, 9/10, 4/5, 3/2 and 7/4
This is the last picture, same as the one at the left.
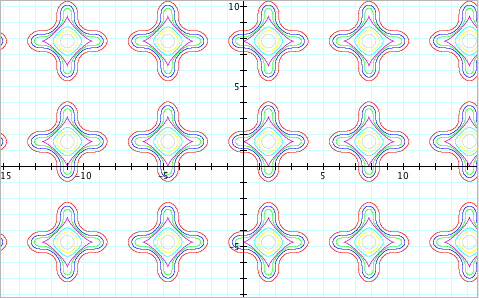
Here is the animation of the equation.
Using technology, such as GSP and Graphing Calculator make mathematics more interesting. The animated and colored graphs help students visualize well mind-boggling mathematical equations. Thus, using technology as a tool in teaching mathematical concepts is a must to every mathematics educators.